|
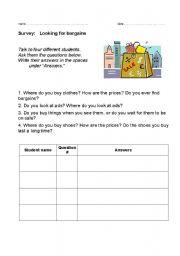
Clothes: Class survey
Students ask and answer questions about shopping for clothes. Follow up with graphic representation of data: (1)Tally the data for Question 1, then (2) outline a bar graph on the board, using the most popular stores and the number of students who shop in each one. (3) Volunteers fill in the graph at the board, (4) while the rest of the class makes a copy in their notebooks using colored pencils or crayons.
Level:elementary
Age: 14-17
Downloads:5 |
|
Copyright 20/11/2008 Janet Johnson
Publication or redistribution of any part of this
document is forbidden without authorization of the
copyright owner.
|


see more worksheets by maestra545
|